
updated: 2021-07-21
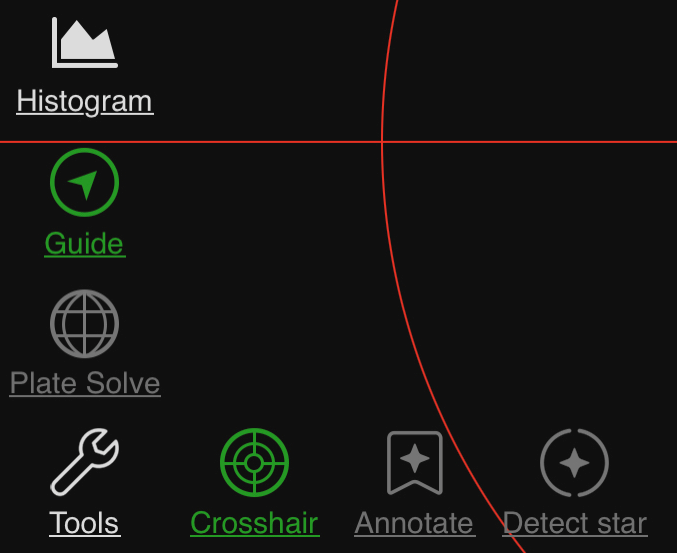
- Histogram
- Guide
- Plate Solve
- Additional Tools
- Crosshair
- Annotate
- Detect Star
Histogram
The histogram area displays the statistical values of the currently displayed image, including the maximum value, minimum value, average value, and mean square deviation, where the peak indicates the maximum brightness of the image. Using the AUTO button you can perform an automated stretch operation to display the image correctly before processing and using the plus symbol you can enlarge the graph for finer adjustment of the image. It is recommended to keep "Automatic" on. The Reset button- resets the stretch if required.
Guide
Activates the guide quality graph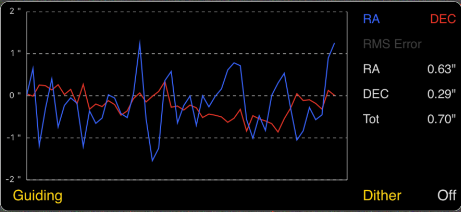
Crosshair
Creates a crosshair over the image to allow accurate centering of the image.
Created with the Personal Edition of HelpNDoc: Full-featured Help generator